Autoscan Project Report
Ruigang Yang, Matthew Joel Laibowitz
Department of Computer
Science
Columbia Univeristy, New York, NY
10032
email: ryang, mjl33@cs.columbia.edu
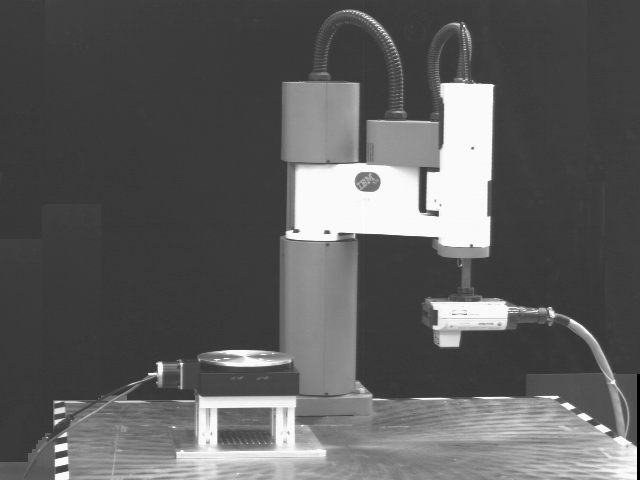
This autoscan program is the software package of a automatic range data
acquisition system(see above). It runs under solaris OS to control a Servo-Robot laser
rangefinder attached to a IBM 7575 SCARA Robot and a motorized turntable
on which the object is placed. It consists of 2 major components: robot control
and data process, implemented by Matthew
Joel Laibowitz and Ruigang
Yang, respectively.
It features:
This program is written using a combination of C and Tcl/Tk. Most low level operations are written in C as external subroutines. The Tcl/Tk part is the main program, which provides a friendly graphical user interface and makes external calls to execute the C programs.
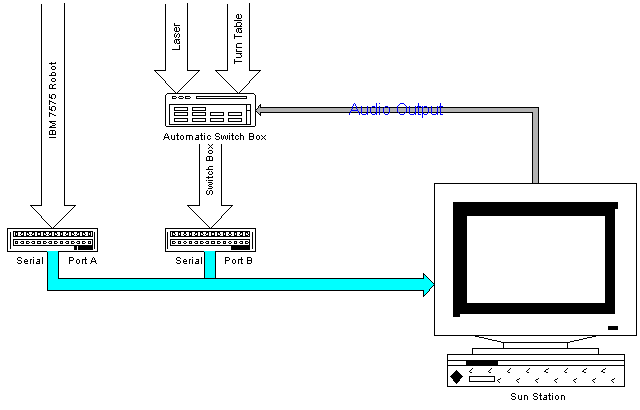
All communication between the robot and the workstation is via the serial port(refer to Hardware Configuration). IBM 7575 Robot uses a separate serial port. The range finder and turntable share a port. The audio devices is used as a trigger to switch between the rangefinder and the turntable.
After the data has been acquired and saved in the disk cache, the control
unit calls the process unit. The process unit first calls a external C program
to convert the raw data to a gray-scale image, a scan-line image and create a
a histogram, then displays this infomation in new windows
The algorithm to draw the scan-line image from 3D data points is described
in Computer Graphics by Foley, etc. The gray scale
image is acquired by stretching/compressing the range data to 256 gray levels. The background is always black, with closer values brighter.
All these images are stored in the PPM format, which can be viewed by a
generic image viewer like xv or Imagetools.
The user can view the scan-line image from an arbitrary view point.The
rotation program first rotates the normalized
3D data points (all with in a unit cube which center is at the origin), then
projects them on the z=1 plane using 1 point perspective projection.
The data histogram is drawn using the Tk canvas widgets. It not only
displays the histogram, but also provides a means for user to perform distance
thresholds to eliminate unwanted backgroud. The user can define 2 thresholds using
rulers provided in the user interface, the program will stretch only the data that fall within the 2
thresholds to get an enhanced object-only gray scale image.
File converter: the raw data could be saved in 4 file formats, raw data, Wavefront Obj file, PLY file and VRML file. The data saved as the last 3 formats is the mesh representation of the raw data in world frame. The OBJ and PLY file converter was written by M. Reed, and the VRML converter was written by John L. Moreland.
in C:
in TCL:
SunOS 5.5 or above, True color display ( recommended)
run the autoscan program.
It could take 1-2 min before the GUI appears. If there is nothing happened for a long time, shut down the program, check the hardware connection and try to run the queryt program provided in this package to check the serial line connection.
|
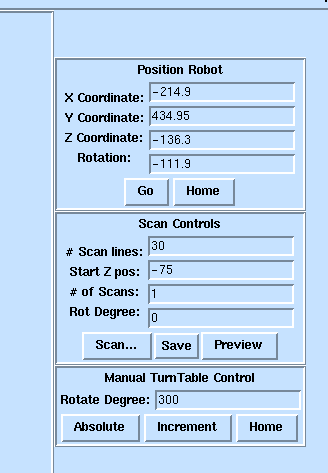
In the right part of main window, as shown in left, there are 3 control panels. The top one is the IBM robot control panel. It displays the current position of the robot. The user can input some value to move the robot to a certain position. The bottom panel is the turntable control panel. It could manually control the turn table to turn to a certain degree. The current degrees of the turn table is also displayed there. The middle one is the scan control panel. It requires 4 parameters. # of scanlines, start_height (in the robot frame), # of scans and the degrees of every rotation. the z-step between 2 consecutive scanlines is 1 mm. The user can click the Preview button to get one quick scan of the object. the gray scale image of the scan will be displayed at the left window. The Save button is to save the scaned data in different format . The Scan... button is to start an automatic multiple scans. |
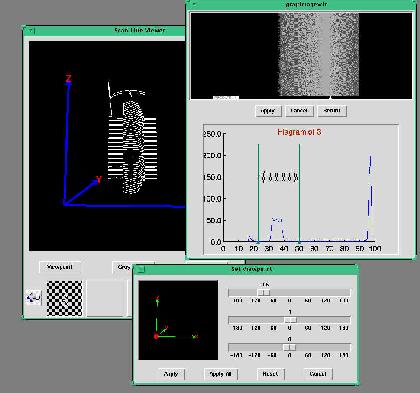
After the range data is acquired, the scanline image viewer window will popup. It displays the scan line image in the top window. The bottom of the window contains the icons of different scans. The user can click on these icons to display the image in the top window. The user can also click the Viewpoint to rotate the scan-line image or click the Gray Image to view the grayscale image of the scan. In the gray image window, the user can view the histogram by clicking the Histogram button. The X-axis stands for the z-value of the rangedata points. Y-axis is the relative value of the data distribution. The user can use the 2 rulers to specify 2 thresholds, then clike Apply to get a new gray scale image. Only the datapoints that fall within the 2 thresholds will be displayed. Thus, the user can have an enhanced image of the object.
Prof. Peter K. Allen provided a lot of guidelines during the development of this software. Michael Reed deserves credit for always being willing to answer my questions about the technical details of the robot and rangefinder system.We here present our gratitude for their kind help.
Last modified by Ruigang Yang on March 27, 1997